Hi {{ first name | there }},
Referrals might just be the oldest (and most powerful) growth engine in the book.
Take my house-builder Ryan. Never had a website, no social media - just a string of happy customers passing his name along.
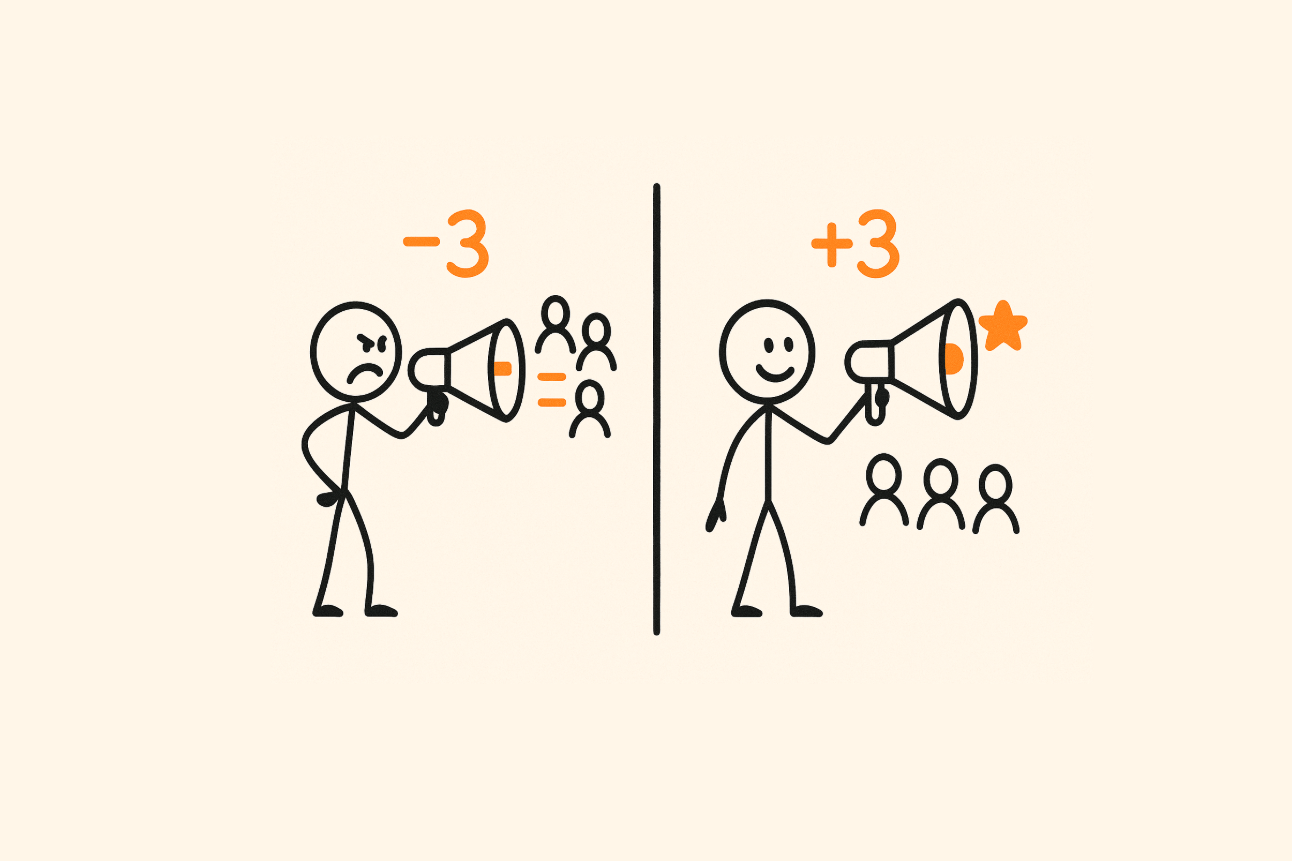
And while happy customers can be your best route to referral, unhappy ones talk too. Often louder, sometimes telling 3x as many people.
Think about that. One detractor could cost you three new customers.
That’s why it’s so valuable to measure not just when referrals happen, but how likely they are to happen in the first place.
And that’s where the Net Promoter Score (NPS) comes in - a simple question that asks customers how likely they are to recommend your product to a friend or colleague, scored on a scale of 0 to 10.
Here’s the shorthand:
9–10: Promoters – your top-tier advocates
7–8: Passives – satisfied but not enthusiastic
0–6: Detractors – potentially spreading negative word-of-mouth
Most teams stop here.
But the real value starts with one simple follow-up: “Why did you give that score?”.
That “why” uncovers the outcome they were hoping for when they chose your product. For those Passives and Detractors, It's the reason behind their rating.
But here’s the trap:
Stopping after the first "why" means you miss the gold.
The richest NPS insights come when you go one level deeper, with a handful of open-ended questions tailored to your product, like:
What pulled you towards our product in the first place?
What’s been the biggest unexpected benefit?
What’s still harder than it needs to be?
These extra prompts begin to reveal what customers actually value and the job they hired your product to do.
🧠 A quick challenge
This week, pick three customers and ask them one of those open-ended questions. You might be surprised at what you learn…
Turn feedback into growth
And when you’ve got all that feedback… that’s when the real magic happens.
You can start grouping it into themes that reveal - not just loyalty drivers - but your biggest growth opportunities.
Lately, I’ve been using Google’s Notebook LM for this type of work. It’s free, fast, and surprisingly accurate at spotting patterns in qualitative feedback. Here’s the process:
Upload your survey data in a Google doc or Sheet as a source then Run this 3-step prompt in Notebook LM:
Spot the outcomes – “List each NPS score with the exact outcome or progress the customer mentioned, plus any pain or struggle they described.”
Cluster into jobs – “Group these outcomes into jobs-to-be-done themes with a short label, one-sentence description, and count of responses.”
Pull the gems – “For each top job theme, give the most vivid customer quote that captures the moment they realised they needed [your product].”
When you’ve run all three prompts, Notebook LM will hand you a neatly organised set of themes, backed by customer quotes you can drop straight into planning docs, marketing copy, or sales conversations.
You’ll see exactly what “success” looks like for your customers, and the struggles that pushed them to your product in the first place.
And the best part?
Every insight you uncover doesn’t just fuel growth, it strengthens customer loyalty and helps you reduce churn. By understanding why your customers stick around (or why they might leave), you’re ultimately building a more loyal, resilient customer base.
I’d say that’s worth the effort.
Cheers,
Peter
P.S. Have you run an NPS survey before? Hit reply - I’d love to hear what you learned.
P.P.S. Did someone forward you this email? Was it helpful? Sign-up here.

